REIT Total Return – Full Portfolio Review Heading into April 2025
Investing through Volatile Markets
Given the rapid market movement, this portfolio update will be a bit different. We will still present the portfolio’s analytical data, but primarily, we want to discuss the fundamental impact, market price impact, and how the two may not always be directly related.
Market price impact does not necessarily imply fundamental impact
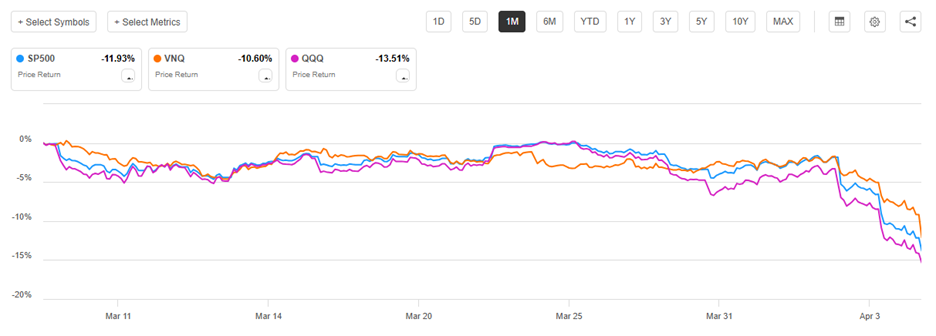
As I’m sure you are aware, the stock market dropped rapidly in the first week of April.
It had been somewhat weak for a month, with the declines accelerating as the large-scale tariffs were announced on April 2nd.
Seemingly nothing was spared in the market carnage. The S&P fell, NASDAQ got clobbered, and REITs went along for the ride. Even utilities joined in on the rout in the last 5 days.
The market fall can be described in two parts.
March was orderly selling. Market participants were considering fundamental impacts and selling according to what would be fundamentally harmed by the potential tariffs that were already impending in March.
However, when the news came of a more sudden and larger magnitude of tariffs, the selling became disorderly. Everything was suddenly correlated, whether it was fundamentally impacted or not.
There are a couple of reasons for the enhanced correlations during the high-volume rapid sales in early April.
- ETFs
- Forced selling
With a substantial portion of trading done through ETFs these days, selling behavior is less targeted.
Some stocks are highly impacted fundamentally, while others are relatively isolated from the change. However, if the stocks are in the same ETF, they get sold together.
There could also be selling of individual securities outside of ETFs due to forced selling from margin calls or other reasons to need capital immediately.
As the highly impacted stocks sold rapidly, that triggered a capital raise event for many traders, and naturally, they would sell the stocks that were down less. As such, utilities and other largely fundamentally immune sectors got hit in the erratic selling of April as they became sources of capital.
Some stocks with low trading volume have gotten hit even harder. Even a few instances of people selling could have major impacts on low volume stocks, as there simply were not enough active bids to support the sales.
Through these mechanisms and probably others which we are not considering at the moment, rapid disorderly sell-offs tend to be fundamentally agnostic.
Eventually, the market will calm down. When it does, fundamentals will matter again. The stocks that were fundamentally harmed may stay at the now lower price while those with strong operations that were simply caught in the crossfire have a better shot at rebounding faster or more fully.
With that in mind, let us examine the portfolio and take a look at potential fundamental impact.
REIT Total Return metrics
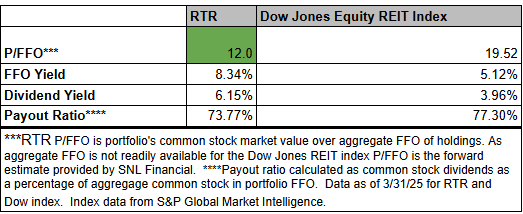
We continue to be significantly tilted toward value with a weighted average P/FFO of 12X, which is an 8.34% FFO yield. This is quite a bit cheaper than the Dow Jones REIT Index at 19.52X FFO and a 5.12% FFO yield.
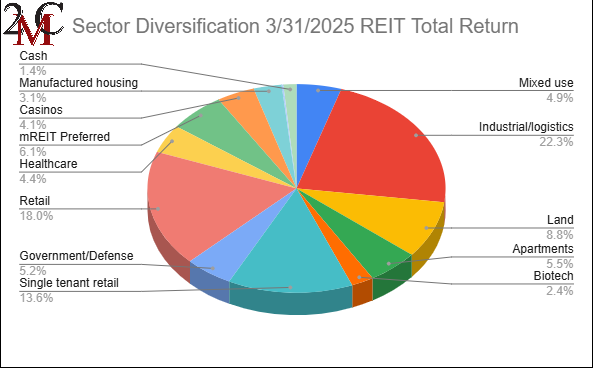
The current news flow impacting the market doesn’t specifically benefit or hurt value. It is much more likely to be fundamentally split by business model. Here is the sector breakdown of REIT Total Return.
REIT fundamentals with tariff news
REITs are much more domestic than the broader market. FactSet data as presented by S&P Global showed that:
“Nearly 71% of S&P 500 revenues came from the U.S., while the remaining came from foreign markets.”
In contrast, REITs get nearly all of their revenue from the U.S. There are a few REITs, such as Prologis, Simon Properties, and W.P. Carey, that have properties all over the world, but even those are not really international in the trade sense of the word. Simon’s malls in Europe get revenue domestically within the countries in which they are located.
REITs do almost no importing, except for construction materials for those with development arms.
Tariffs will likely make development more expensive, which will modestly harm the development arms of these companies. However, more expensive construction is overall a very good thing for REITs.
Development is a tiny fraction of the overall REIT value with the vast majority of value being the standing properties they own. These standing properties do not like construction. New construction is competition, so to the extent tariffs on things like lumber or steel make construction more expensive, fewer buildings will be built, which means existing buildings become more valuable.
REITs, at an index level, are substantially less exposed to trade than the broader market.
Overall take and how we are playing it
The fundamental impact on REITs is relatively small given their domestic and contractual revenues. We would anticipate very minor changes to REIT AFFO guidance as 1st quarter earnings reports come out. The changes are also likely to be in both directions, as some REITs are benefiting.
When the fundamental impact is compared to the wild price drop that REITs suffered along with the broader market, we think there is a rebound ahead. When the dust settles and AFFO guides are reaffirmed, it should become clearer that REITs are undervalued. This price drop was off of an already undervalued level, so there is quite a bit of room to rebound.
At 8.3% FFO yield, the stocks underlying RTR have a substantial amount of cashflow that we believe many will find attractive given the contractual nature of most of it.
We are not selling into the panic. These are durable businesses with durable cashflows.
Evolving economies create opportunity
Our REIT Total Return Portfolio is actively managed to pivot into wherever the opportunity is greatest. We are now offering portfolio mirroring in which the trades in our REIT Total Return Portfolio are automatically executed in client portfolios simultaneously and at the same price.
Important Notes and Disclosure
Material Market and Economic Conditions. March 2022-2023: Significant increases in the Federal Funds Rate by the Federal Reserve have caused REIT market prices to decline more than the broader markets. REITs rely on debt financing to acquire properties and fund their operations; expiring lower-cost debt is being refinanced at higher interest rates due to prevailing market conditions. March 2020: REIT Total Return’s value declined substantially as COVID shut down the economy. It recovered in 2021 as the economy reopened. January 2019: Tax-loss selling’s calendar expired and the government reopened on January 25, 2019. The combined effect caused our shares to rise more than the broader markets. December 2018: Another Fed-Funds rate hike, unresolved US-Chinese trade, a partial government shutdown, and an exaggerated tax-loss selling season put extreme downward pressure on equity prices. All of these factors contributed to diminished liquidity and more significant share price declines in small-cap/value issues; REIT Total Return is focused on small-cap/value issues, so our decline was significantly more precipitous.
Material Conditions, Objectives, and Investment Strategies. REIT Total Return is an actively managed investment portfolio of real estate equities, primarily common and preferred shares of REITs, with an aim to generate high total returns from a mix of dividends and capital appreciation.
All REIT Total Return Portfolio performance information on this page is based on the performance of the Portfolio Manager’s account, using the manager’s own funds. Performance of the Portfolio Manager's account is calculated by Interactive Broker on a daily time-weighted basis, including cash, dividends and earnings distributions, and reflects the deduction of broker commissions (when commissions were charged). Actual client returns will differ. **2nd Market Capital’s advisory fees are simulated and applied retroactively to present the portfolio return “net-of-fees”.
None of the performance information displayed on this page is based on the actual performance of any 2MCAC client account investing in this portfolio. The performance in a 2MCAC client account investing in this portfolio may differ (i.e., be lower or higher) from the performance of the account managing this portfolio and portrayed on this page based on a variety of factors, such as trading restrictions imposed by the client (resulting in different account holdings), time of initial investment, amount of investment, frequency and size of cash flows in and out of the client account, applicable brokerage commissions (when commissions were charged), and different corporate actions. Clients investing in this portfolio may view the actual performance of their investment in this portfolio by logging into their Interactive Brokers account and reviewing their customized dashboard.
Clients may restrict any of the securities traded in their account but should note that any restrictions they place on their investments could affect the performance of their account leading it to perform differently, worse or better, than (a) the above-portrayed account or (b) other client accounts invested in the same portfolio.
Forward-looking statements. Commentary may contain forward-looking statements which are by definition uncertain. Actual results may differ materially from our forecasts or estimations, and 2MCAC cannot be held liable for the use of and reliance upon the opinions, estimates, forecasts, and findings in these documents.
Past performance does not guarantee future results. Investing in publicly held securities is speculative and involves risk, including the possible loss of principal. Historical returns should not be used as the primary basis for investment decisions. Although the statements of fact and data in this commentary have been obtained from sources believed to be reliable, 2MCAC does not guarantee their accuracy and assumes no liability or responsibility for any omissions/errors.
Use of Leverage or Margin. REIT Total Return Portfolio will utilize margin only for trading purposes (the ability to use the proceeds from stock sales immediately for new purchases instead of waiting for settlement), but not for borrowing purposes.
Benchmark Comparison. Our REIT Total Return Portfolio is compared to the Dow Jones Equity REIT Index and the MSCI U.S. REIT index because they are common REIT Indices. The Dow Jones Equity All REIT Index is designed to measure all publicly traded equity real estate investment trusts (REITs) in the Dow Jones U.S. stock universe. The MSCI US REIT Index is comprised of equity real estate investment trusts (REITs) eligible included within the eight Equity REIT Sub-Industries of the Equity Real Estate Investment Trust (REITs) Industry. It is not possible to invest directly in the Dow Jones Equity All REIT Index or MSCI US REIT index. Index returns do not represent the results of actual trading of investible assets/securities. Index returns do not reflect payment of any sales charges or fees an investor may pay to purchase the securities underlying the index. The imposition of these fees and charges would cause the actual performance of the securities to be lower than the Index performance shown. The results portrayed include dividend income. Our REIT Total Return Portfolio may include REITs that are not eligible for inclusion in the Dow Jones Equity All REIT Index or MSCI US REIT Index.
There can be no assurance that a benchmark will remain appropriate over time and 2MCAC will periodically review the benchmark’s appropriateness and decide to use other benchmarks if appropriate.
Expenses. Returns reflect the deduction of any transaction expenses. REIT Total Return's advisory fees are simulated and applied retroactively to present the portfolio return “net-of-fees”.
Calculation Methodology. Returns are calculated by 2MC with data from Interactive Brokers LLC using the Modified Dietz method, a time-weighted measure of performance in which cash flows are weighted based on their timing. Dividends in REIT Total Return are reinvested.
S&P Global Market Intelligence LLC. Contains copyrighted material distributed under license from S&P.
Discover more from 2nd Market Capital Advisory Corp
Subscribe to get the latest posts sent to your email.


